
bubble
US /ˈbʌbəl/
UK /ˈbʌbl/
- n. (c.)泡
- v.i.泡立つ;気持ちがあふれる
B1 中級TOEICもっと見るgive up
US /ɡɪv ʌp/
UK /ɡiv ʌp/
- phr. v.諦める : 降伏する;~しないようにする;(困難なので)断念する;降伏する;(時間を)当てる : (労力を)捧げる
A1 初級もっと見るgo around
US /ɡo əˈraʊnd/
UK /ɡəu əˈraund/
- phr. v.(ニュース : 噂が)知れ渡る : 広まる;あちこちに行く : 歩き回る
A1 初級もっと見るgo out
US /ɡo aʊt/
UK /ɡəu aut/
- phr.外出する
- phr. v.(火が)燃え尽きる : 消える;流行が廃れる;外出する;付き合う;潮が引く
- v.i.流行遅れになる
A1 初級もっと見るhave to
US /hæv tu/
UK /ˈhæv tə/
- aux. v.する必要がある
A1 初級もっと見るin the past
US
UK
- phr.過去に
A1 初級もっと見るin the world
US /ɪn ði wɜrld/
UK /in ðə wɜː(r)ld/
- phr.一体全体;世界で;絶対;少し
A1 初級もっと見るin time
US /ɪn taɪm/
UK /in taim/
- adv.そのうちに;間に合って
- phr.間に合って;時間通りに
A1 初級もっと見るinstead of
US /ɪnˈstɛd ʌv/
UK /inˈsted ɔv/
- prep.の代わりに
- adv.そうではなく
A1 初級もっと見るinternet users
US
UK
- n. pl.インターネット利用者
A1 初級もっと見るlaughter
US /ˈlæftɚ, ˈlɑf-/
UK /ˈlɑ:ftə(r)/
- n. (u.)笑い声;笑い;笑み
A2 初級もっと見るlive on
US
UK
- phr. v.生き続ける;頼って生きる;生活する;〜で生活する
live up
US /liv ʌp/
UK /liv ʌp/
- phr. v.期待に応える
A1 初級もっと見るlook at
US /lʊk æt/
UK /luk æt/
- phr. v.見る;注目する;見る;調べる
A1 初級もっと見るlook upon
US /lʊk əˈpɑn/
UK /luk əˈpɔn/
- phr. v.みなす
A1 初級もっと見るmove back
US /muv bæk/
UK /mu:v bæk/
- phr. v.後退する;元の位置に戻す
A2 初級もっと見るmove over
US /muv ˈovɚ/
UK /mu:v ˈəuvə/
- phr. v.場所を空ける;転職する
move up
US /muv ʌp/
UK /mu:v ʌp/
- phr. v.昇進する;前に進む
B1 中級もっと見るof age
US /əv eɪdʒ/
UK /əv eɪdʒ/
- prep. phr.成人の年齢に達した
A2 初級もっと見るof course
US /ʌv kɔː(r)s/
UK /ɔv kɔː(r)s/
- adv.もちろん
- phr.もちろん
- interj.承知しました
A2 初級もっと見るon equal terms
US /ɑn ˈikwəl tɝmz/
UK /ɒn ˈi:kwəl tɜ:mz/
- prep.対等な条件で
B2 中上級もっと見るon the way
US /ɑn ði we/
UK /ɔn ðə wei/
- phr.途中で
A1 初級もっと見るon to
US /ɑn tu/
UK /ɔn tu:/
- prep.上へ;〜に気づいて
- adj.気づいて
A1 初級もっと見るon top of that
US
UK
- phr.その上
A1 初級もっと見るover to
US
UK
- prep.〜に;〜に;〜へ
percent
US /pɚˈsɛnt/
UK /pə'sent/
- adv.1パーセント
- n. (c./u.)パーセント : 百分率;パーセント;パーセント;パーセント記号;パーセント
A2 初級TOEICもっと見るpopulation
US /ˌpɑpjəˈleʃən/
UK /ˌpɒpjuˈleɪʃn/
- n. (c./u.)人口;個体群;母集団;母集団
A2 初級TOEICもっと見るpoverty
US /ˈpɑvəti/
UK /ˈpɔvəti/
- n. (u.)貧困;貧困
B1 中級もっと見るrate as
US
UK
- phr. v.~と評価する
B1 中級もっと見るsplit
US /splɪt/
UK /splɪt/
- adj.決別した;割れた;対立の
- v.t./i.真っ直ぐに切って分けられる;割れる;対立する;分割する;公平に分ける
- n. (c./u.)対立;分離
A2 初級もっと見るtake off
US /tek ɔf/
UK /teik ɔf/
- phr. v.(服などを)脱ぐ;休暇を取る;(人を)まねる;去る;(飛行機が)離陸する;(ある価格を)割り引く;なくす
- v.t./i.脱ぐ;出発する;成功する;休暇を取る;真似る
- v.i.離陸する
A1 初級もっと見るtake out
US /tek aʊt/
UK /teik aut/
- phr. v.(免許 : 許可証などを)申請する : 取得する;(人を)デートに連れ出す;命を奪う;(物を)~から取り除く;(保険)を掛ける : (担保に)入れる;持ち帰り
- n. (u.)テイクアウト
A1 初級もっと見るthink about
US /θɪŋk əˈbaʊt/
UK /θiŋk əˈbaut/
- phr. v.考慮する;思い出す
A1 初級もっと見るto do with
US
UK
- phr. v.〜と関係がある
A1 初級もっと見るtogether with
US /təˈɡɛðɚ wɪð/
UK /təˈɡeðə wið/
- prep.~と一緒に;含めて
A1 初級もっと見るunited
US /juˈnaɪtɪd/
UK /jʊ'naɪtɪd/
- v.t./i.連合した団結した : 結合した
- adj.ユナイテッド
A2 初級もっと見るup there
US /ʌp ðɛr/
UK /ʌp ðɛə/
- adv.あそこ;天国で;トップレベルで
A1 初級もっと見る
Vocabulary
- have to: する必要がある
- in the world: 一体全体
- up there: あそこ
- look at: 見る
- of course: もちろん
- think about: 考慮する
- instead of: の代わりに
- internet users: インターネット利用者
- together with: ~と一緒に
- live up: 期待に応える
- move up: 昇進する
- give up: 諦める : 降伏する
- move over: 場所を空ける
- over to: 〜に
- take out: (免許 : 許可証などを)申請する : 取得する
- on top of that: その上
- in time: そのうちに
- look upon: みなす
- take off: (服などを)脱ぐ
- of age: 成人の年齢に達した
- on equal terms: 対等な条件で
- move back: 後退する
- rate as: ~と評価する
- on the way: 途中で
- in the past: 過去に
- go out: 外出する
- go around: (ニュース : 噂が)知れ渡る : 広まる
- to do with: 〜と関係がある
- on to: 上へ
- live on: 生き続ける
- world: 人間社会
- split: 決別した
- population: 人口
- poverty: 貧困
- country: 国
- put: 置く
- laughter: 笑い声
- bubble: 泡
- health: 健康
- percent: 1パーセント
- united: 連合した団結した : 結合した
- south: 南の : 南にある
- rich: 裕福な : 金持ちの
- income: 収入
- America: アメリカ
アプリで完全な体験を
いつでもどこでも学習、文章と使い方を詳しく解説
01:03
She took a brave step forward, leaving behind her comfort zone to chase her dreams.
単語・フレーズ
- brave
adj. 勇気のある
- comfort zone
phr. コンフォートゾーン
文の解説
a brave step は名詞句で、brave は形容詞として名詞 step を修飾し、「勇敢な一歩」を意味します。
forward は副詞として step を修飾し、「前へ」を意味します。
この句全体が目的語となり、took(動詞)の「何を」に答えています——彼女は勇敢な一歩を前へ踏み出した。
アプリで完全な体験を
いつでも単語を調べて、発音・品詞・使い方をマスター
brave
US/brev/
UK/breɪv/
adj.勇敢な
v.t.勇敢に立ち向かう
A2 初級
アプリで完全な体験を
いつでもどこでもスピーキング練習、即時に発音フィードバック
Try this speaking exercise.
この文を真似して練習してみましょう。
80
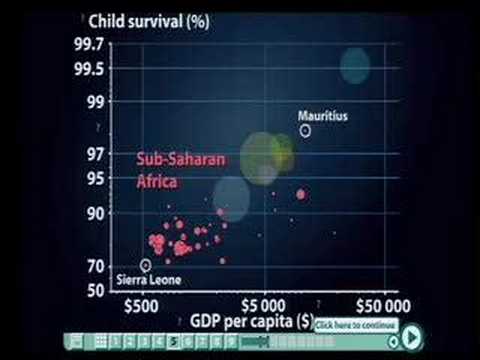
【TED】ハンス・ロスリング:第三世界の神話を覆す、かつてないほどの優れた統計 (【TED】Hans Rosling: Debunking third-world myths with the best stats you've ever seen)
0
kevin han が 2021 年 01 月 14 日 に投稿「第三世界」に関するよくある誤解を、ハンス・ロスリングが驚くべき統計データとビジュアルで解き明かす動画です。グローバルな開発神話の裏にある真実を知り、同時に高度な語彙力も身につけましょう。この動画で、世界の健康や所得格差について学びながら、楽しく知識を深めることができますよ。
この動画をアプリで学ぼう!
VoiceTubeアプリ版なら、効果的な学習機能がもっと充実しています!